
Remember a .NET analysis of CPU explosion in a pharmaceutical company’s business system
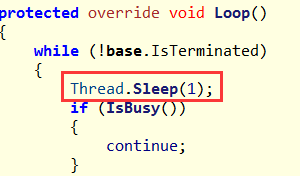
Remember a .NET analysis of CPU explosion in a pharmaceutical company’s business system one: background 1. Storytelling Some time ago, a friend came to me and said that their program had a CPU explosion and asked me to help find out what happened? The best way to solve this problem is to grab a dump and throw it to me. The recommended tool is to use procdump to automate the capture. Two: Windbg analysis 1. Is the CPU really high? Still the same old rule, if you want to find this answer, you can use the !tp command. 0:044> !tp logStart: 1 logSize: 200 CPU utilization: 88% Worker Thread: Total: 8 Running: 4 Idle: 4 MaxLimit: 1023 MinLimit: 4 Work Request in Queue: 0 ———————————————– Number of Timers: 2 ———————————————– Completion Port Thread:Total: 2 Free: 2 MaxFree: 8 CurrentLimit: 2 MaxLimit: 1000 MinLimit: 4 From the data in the hexagram, it can be seen that the current CPU has indeed reached 88%. Next, we will observe whether the machine CPU of this program is powerful. You can use !cpuid to observe. 0:044> !cpuid CP F/M/S Manufacturer MHz 0 6,94,3 GenuineIntel 3192 1 6,94,3 GenuineIntel 3192 2 6,94,3 GenuineIntel 3192 3…